Topics / Statistics / Pie Charts
OCR Foundation · Paper 1 · May 2025 · Q5 · calculator
Pie Charts & Ratio
1 Try it first
From the paper · Q5 · 4 marks
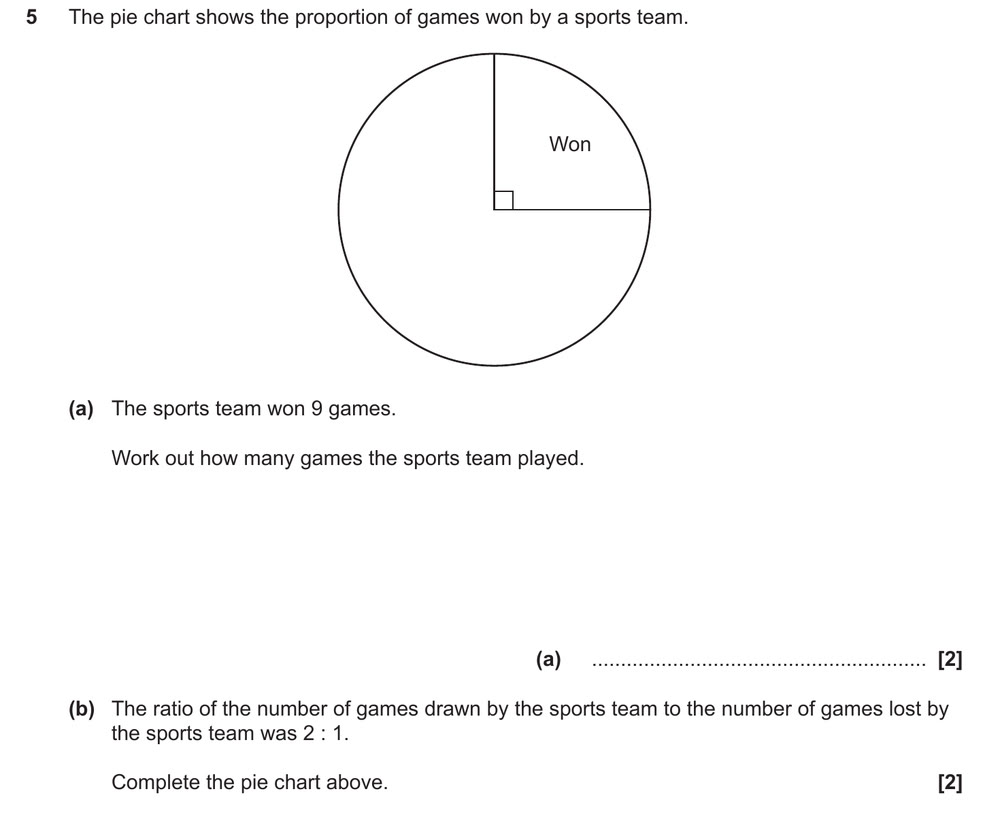
Get a pencil and have a go on paper before you watch.
2 Watch it solved
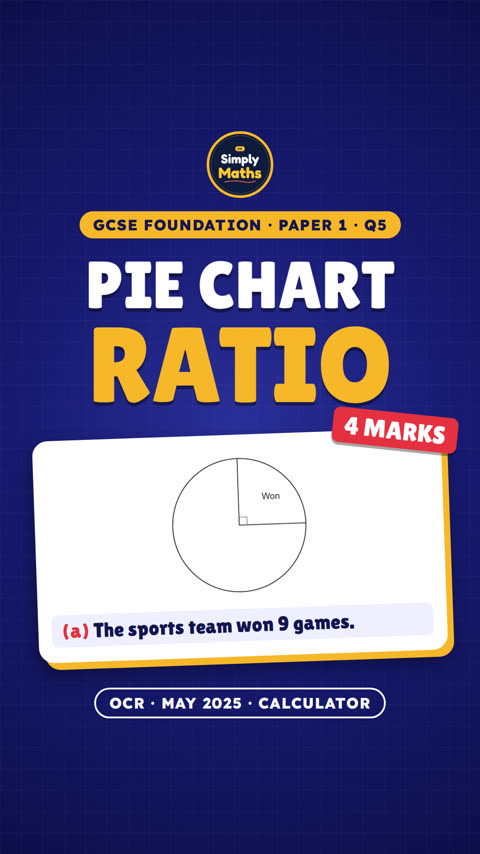 Tried it? Press play. Plays from YouTube.
3 Your turn
Won 5 games = a 60° sector. (a) How many games were played? (b) Drawn : lost = 3 : 2. Find both angles.
Show the answer
(a) Each game is 12°, so 30 games were played. (b) The other 300° split 3 : 2: drawn 180°, lost 120°.